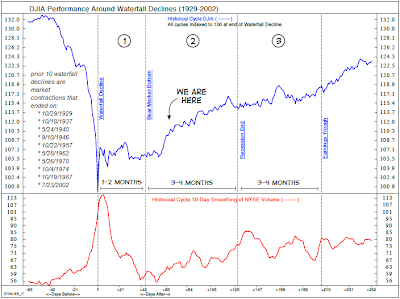
Interestingly, the market's recovery since the March 9th low is following a similar path as 10 prior bear market recoveries. These recoveries occurred after so called waterfall declines.
(click to enlarge)
 Chart Courtesy of: Schwab & Ned Davis Research
Liz Ann Sonders, Chief Investment Strategist at Charles Schwab (SCHW) notes:
In waterfall declines, the Dow loses more than 20% in a short period, and near the end, the 10-day average of NYSE total volume rises to two times its average seen just a few months earlier. In the majority of cases, the end of the waterfall decline wasn't the end of the bear market.
However, in the composite average, the lows were tested but not broken, followed by a basing phase of up to three months before a breakout to a new bull market. The chart below shows the performance of the Dow as averaged from the 10 waterfall declines between 1929 and 2002.
The market's strong advance is now running into technical resistance. The market's close on Friday at 919 is near the 200-day moving average of 928. Additionally, volume has been declining and the MACD is negative with the 12-day moving average below the 26-day moving average.
(click to enlarge)
 The market seems to be in a phase where "less bad" economic and corporate news is viewed positively. In order for the advance to be more than a cyclical bull market and turn into a secular one, some of this "less bad" data will likely need to become "good" data.
No comments :
Post a Comment