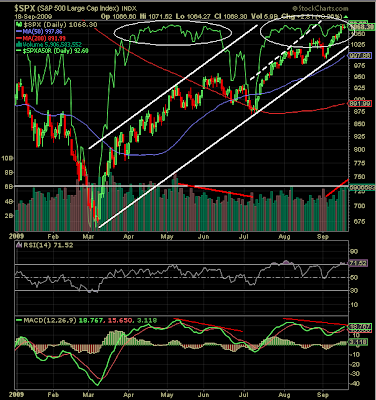
It seems the most frequent comment I receive of late is "the market is due for a pullback" or something along those lines. If you are a contrarian, this is good. The more investors are skeptical of the advance, the more likely it could move higher. However, as the below chart shows, this advance looks like it could or should be topping out.
(click to enlarge)

Since the March 9th closing low of 677 for the S&P 500 Index, the market has advanced nearly 58% to Friday's close of 1,068. No wonder investors believe we need some market consolidation.
A few technical thoughts on the above chart.
A few technical thoughts on the above chart.
- Over 92% of stocks are trading above their 50-day moving average (see white circles at top of chart). The same can be said for the 200-day moving average. This type of chart pattern played out in the April/May period earlier this year. However, the April/May period was one where we saw increasingly lower volume. Today, we are seeing this high moving average percentage, but it is occurring on increasingly higher volume.
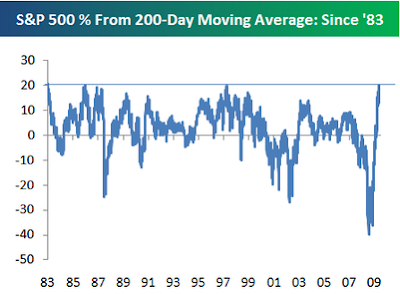
- In addition to the high percentage of individual stocks trading above their 50 and 200 day moving averages, the S&P 500 Index is significantly above its 200 day moving average. Bespoke Investment Group notes the S&P is trading 20% above its 200-day moving average and this has not occurred since May of 1983.
- From a valuation perspective, the market does not seem over or undervalued. The below chart is the P/E of the S&P 500 Index using average inflation adjusted earnings from the past ten years.
(click to enlarge)

- The MACD, both the slow and fast moving average lines are in a downtrend. This could signal market weakness in the near term. Offsetting this concern is the market's recent move higher has occurred on higher volume.
- It is positive to see higher volume, but this past week was a quadruple option expiration one. This expiration day likely influenced the volume for the week. Also, higher volume could be an indication of capitulation buying by investors that have felt left behind given their high cash levels. Volume in the 8 billion range would be more of the capitulation concern and recent weeks have seen volume below 6 billion.
- Are some market strategist that were once bearish now turning bullish? James Grant, editor of Grant's Interest Rate Observer, wrote an article in Saturday's Wall Street Journal titled, From Bear to Bull. He notes in the opening paragraphs of the article:
"As if they really knew, leading economists predict that recovery from our Great Recession will be plodding, gray and jobless. But they don't know, and can't. The future is unfathomable.
Not famously a glass half-full kind of fellow (emphasis added), I am about to propose that the recovery will be a bit of a barn burner. Not that I can really know, either, the future being what it is. However, though I can't predict, I can guess. No, not "guess." Let us say infer."
The entire article by James Grant is a worthwhile read. The below video is an interview with Grant on CNBC in June. A lot of the discussion surrounds the Fed, but the market tone is negative.
So in the end, there is a great deal of conflicting data regarding the sustainability of this market move higher which can be a positive from a market perspective. There are investment opportunities in this climate, but making money in them will not be as easy as it would have been by investing in March.


1 comment :
dont sell it. you can't predict the future.
i dont see anything in the chart
Post a Comment